1. Introduction to Data Science#
1.1. Data Science: Why & What#
1.1.1. Why Studying Data Science?#
There are plenty of good reasons to study data science. Some of them are:
High demand & pay: Data scientists are widely hired across the sectors of tech, healthcare, finance, retail, government, etc.
Transferable skill-sets: Once you learn stats, coding, and problem-solving, you can apply them in many other roles.
Improved decision-making: Data science focuses on obtaining insights from data, which greatly reduce decision pitfalls in organizations.
Foundation for AI/ML: Data science is the gateway to advanced topics in machine learning and AI such as deep learning, advanced natural language processing (NLP), large language models (LLMs), and generative AI.
1.1.2. What is Data Science#
According to U.S. Census Bureau , data Science is “a field of study that uses scientific methods, processes, and systems to extract knowledge and insights from data.” As the Data Science Venn Diagram suggested by Drew Conway (Fig. 1.1), data science is by nature interdisciplinary; and data science practitioners draw on varied training in statistics, computing, and domain expertise.
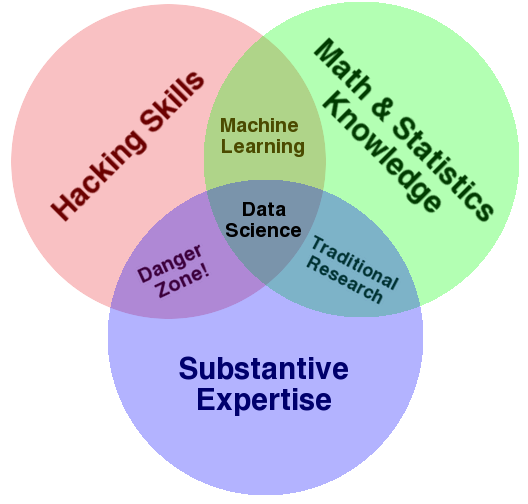
Fig. 1.1 Data Science Venn Diagram#
If we put the related data work fields together, we can see that the data science (broadly defined) fields overlap with each other:
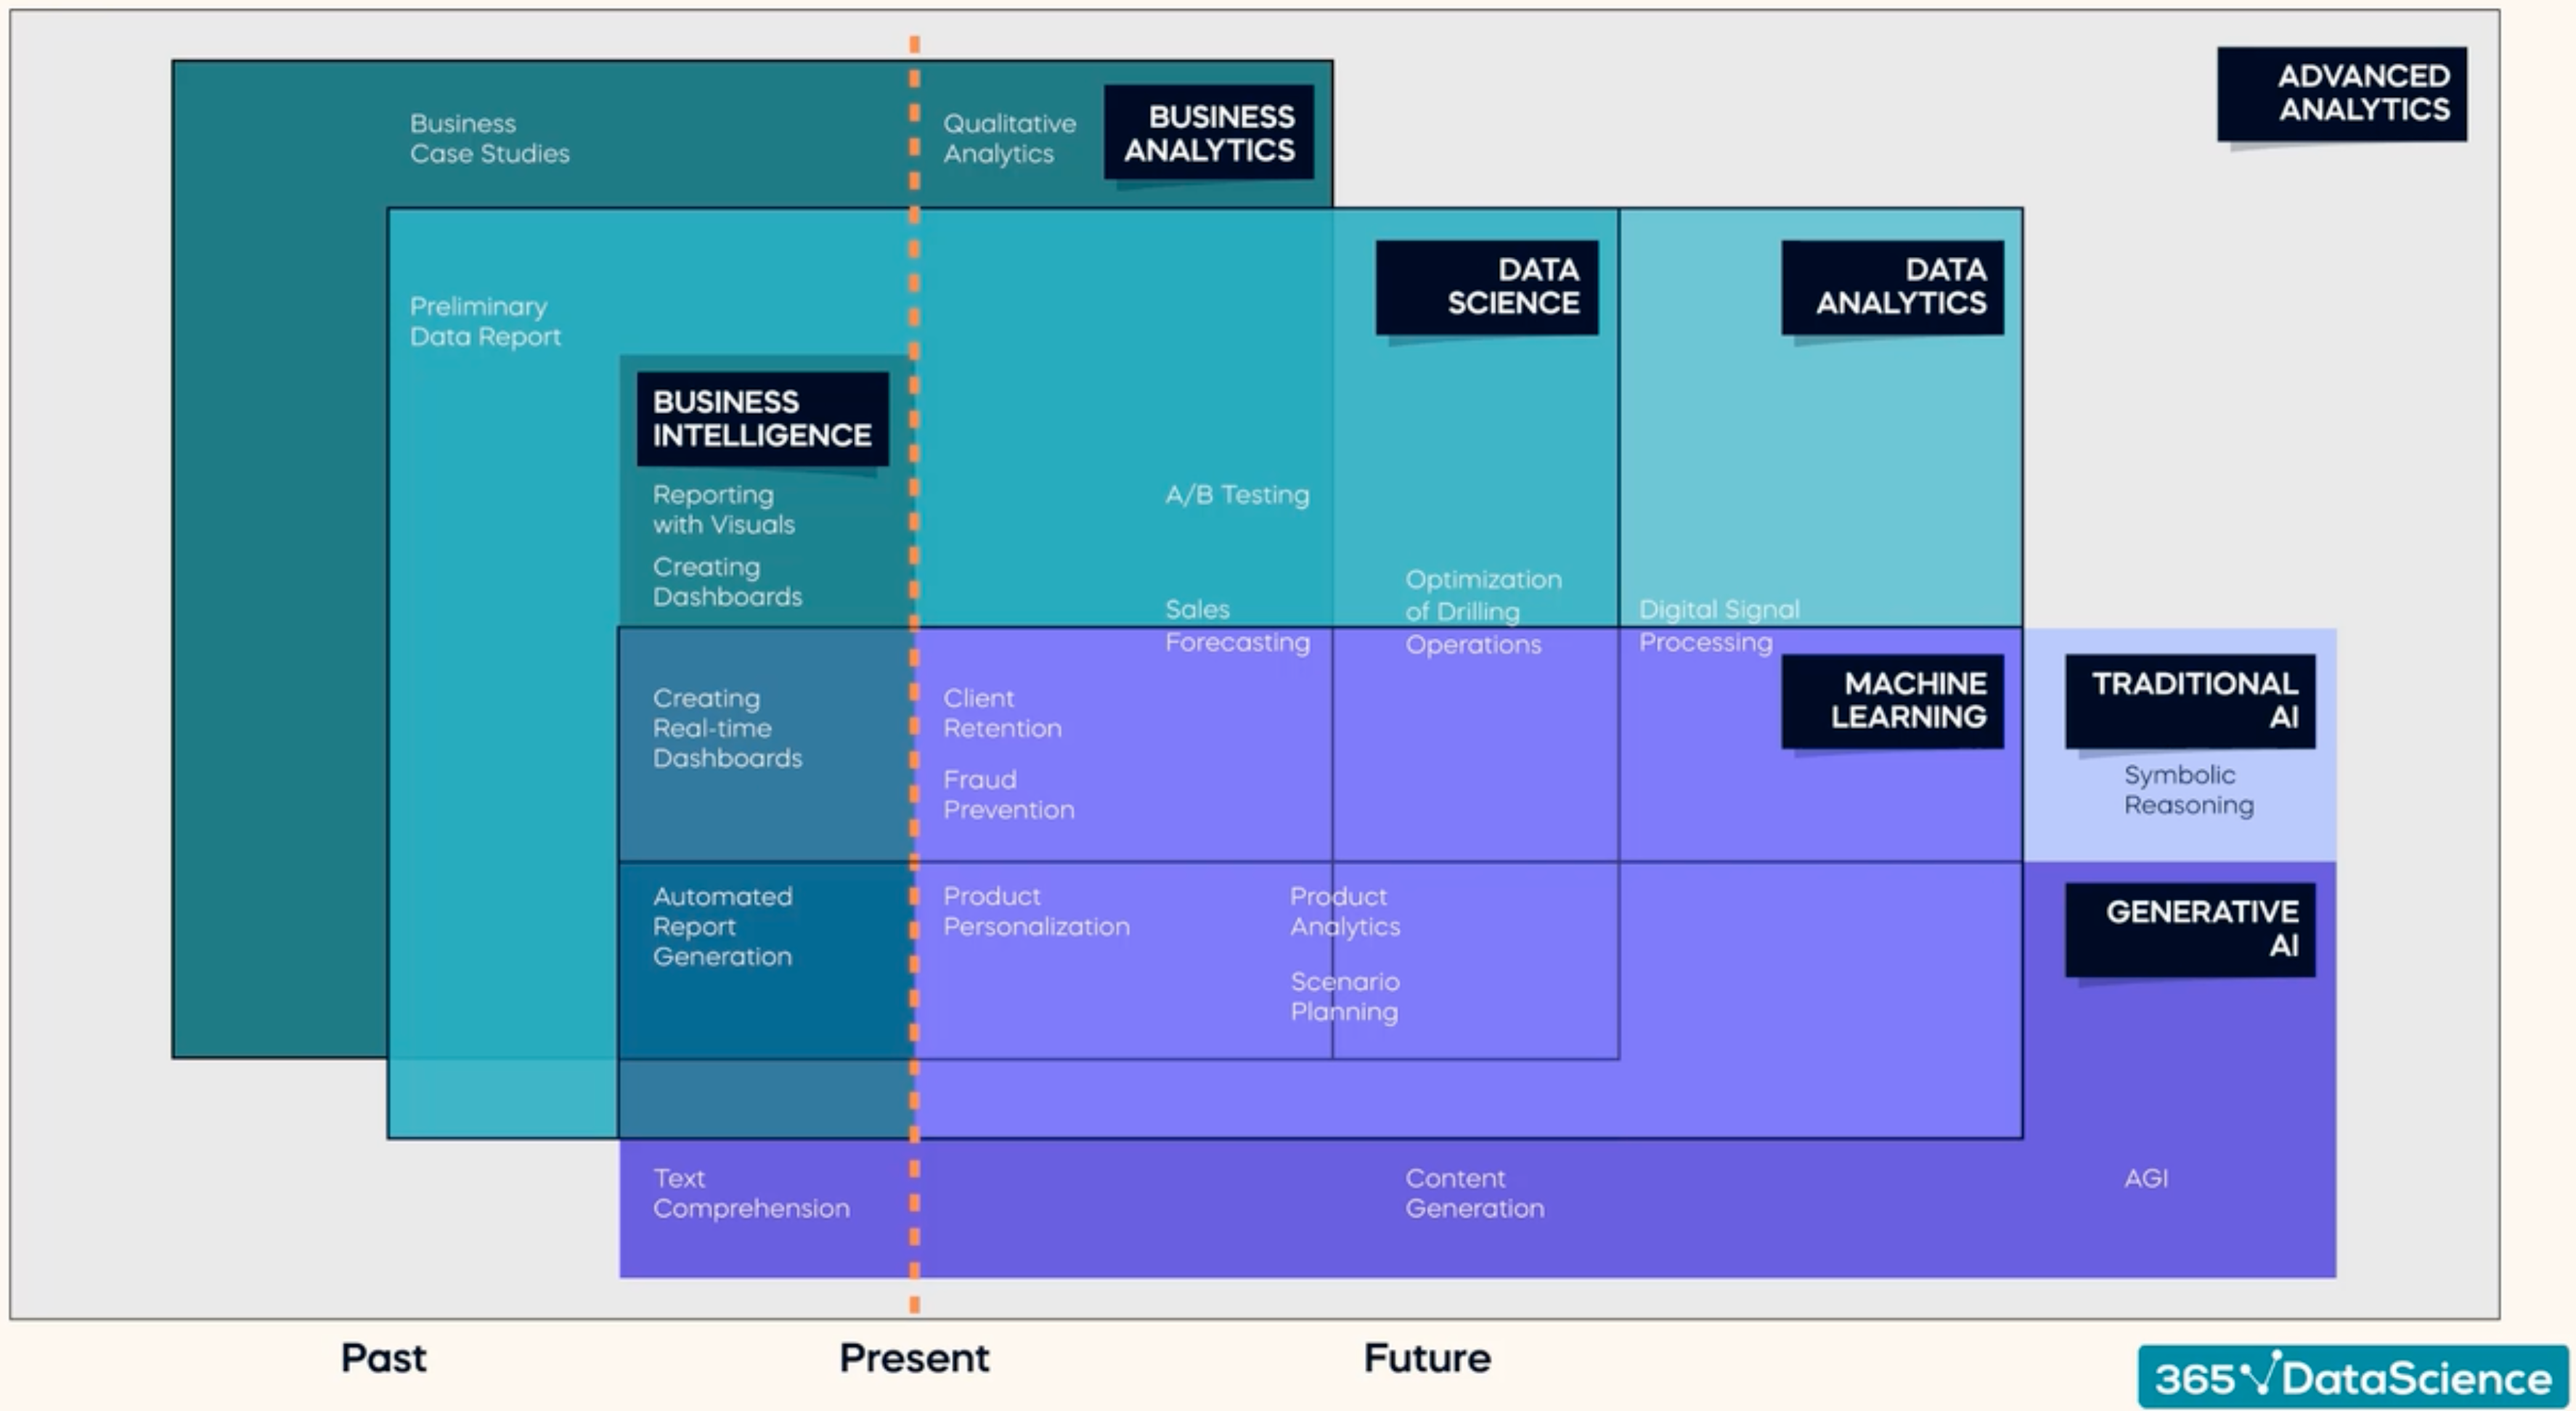
Fig. 1.2 Data Science Fields#
From Fig. 1.2 we can try to define data science by looking at how it relates to other fields. The figure can be understood as having 3 layers: The business layer (dark green), the data layer (light green), and the machine learning/AI layer (purple). We may observe that:
Data science consists most of the fields of data analytics and machine learning.
Data science also has huge overlap with business analytics.
Data science can be considered as a subset of data analytics, just like machine learning.
Business intelligence almost can be considered as a subset of data science with heavy business applications.
AI may be considered as extension of machine learning (but still have certain overlap with data science).
1.1.3. A Historical Note#
From the perspective of decision-making, especially in the business context, researchers and practitioners have been leveraging different data tools to improve the effectiveness and competitiveness of organizations. For example, chronically, the data fields have emerged as:
1970s: Relational databases (SQL), Decision Support Systems (DSS)
1980s: OLTP (Extract → Transform → Load) systems, data modeling (ER), Executive Information Systems (EIS)
1990s: Data warehousing (ETL, or “Extract → Transform → Load”), OLAP (Online Analytical Processing), Business Intelligence (BI: dashboards), Data Mining, KDD (Knowledge Discovery in Databases).
2000s — BI (dashboards & KPIs), Business Analytics.
2000s–2010s — “Data Analytics” for descriptive/diagnostic analysis.
Late 2000s–2010s — Big Data (Hadoop/NoSQL/Spark to meet the volume–velocity–variety features of data).
2010s — Data Science (end-to-end: data wrangling → modeling → communication/impact).
2010s–2020s — Modern ML, NN (neural networks), & Deep Learning
2020s — Responsible AI, GenAI
As observed, overtime, the data-backed decision-making fields have evolved from descriptive (BI/OLAP/EDA/visualization) to predictive and prescriptive (LLM ⊂ DL ⊂ NN ⊂ ML ⊂ AI).
1.2. The Data Science Process#
1.2.1. The CRISP-DM model#
As general process model of conducting a data science, the CRoss Industry Standard Process for data mining, known as CRISP-DM , is widely used as a defacto standard process model to describe the common approaches used for data mining and data science projects. There are 6 phases in this process model:
Business Understanding
Data Understanding
Data Preparation
Modeling
Evaluation
Deployment
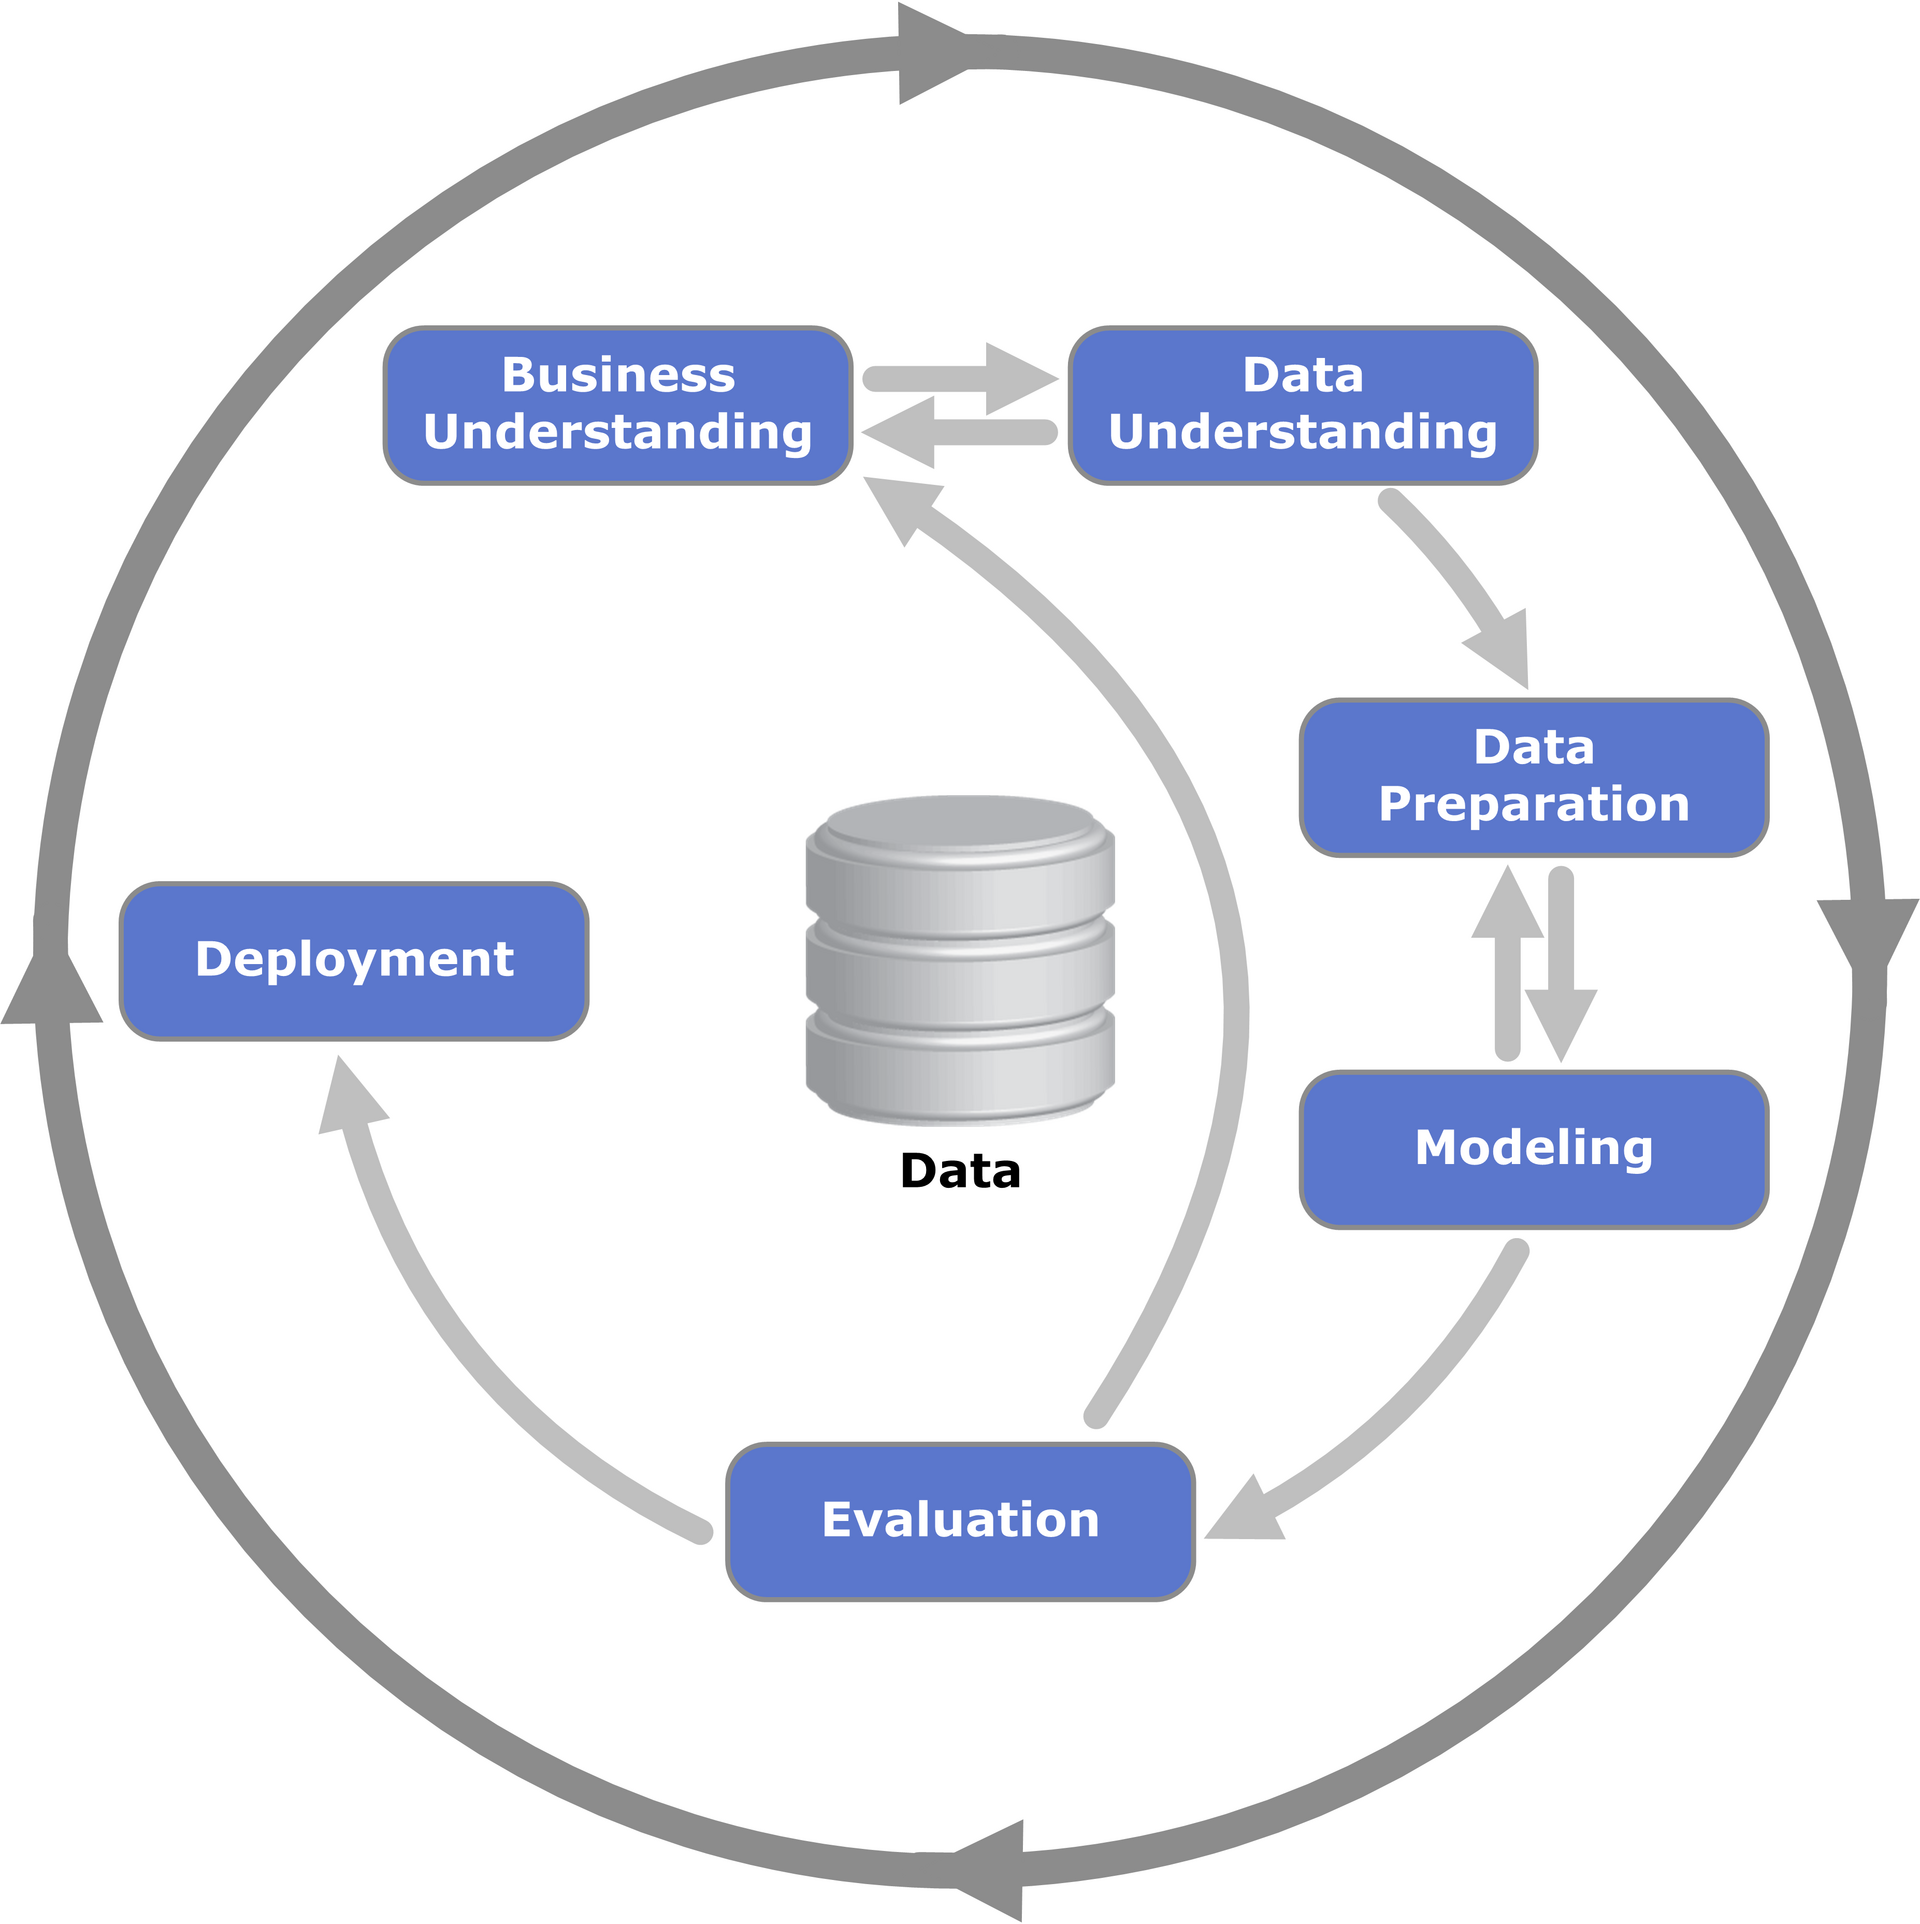
Fig. 1.3 CRISP-DM Process Model#
In addition to the process model, CRISP-DM also has a methodology, which contains specific generic tasks in each of the phases as seen in Table 1.1.
I. Business Understanding |
II. Data understanding |
III. Data Preparation |
IV. Modeling |
V. Evaluation |
VI. Deployment |
|---|---|---|---|---|---|
Determine business objectives |
Collect initial data |
Select data |
Select modeling techniques |
Evaluate results |
Plan deployment |
Assess situation |
Describe data |
Select data |
Generate test design |
Review process |
Plan monitoring and maintenance |
Determine data mining goals |
Explore data |
Clean data |
Build model |
Determine next steps |
Produce final report |
Produce project plan |
Verify data quality |
Construct data |
Assess model |
Review project |
|
Integrate data |
|||||
Format data |
1.2.2. General Data Science Lifecycle Models#
In the industry, practitioners create their own process models based on the CRISP-DM process model. For example, Fig. 1.4 is a general data science lifecycle model with added exploratory data analysis (EDA) process.
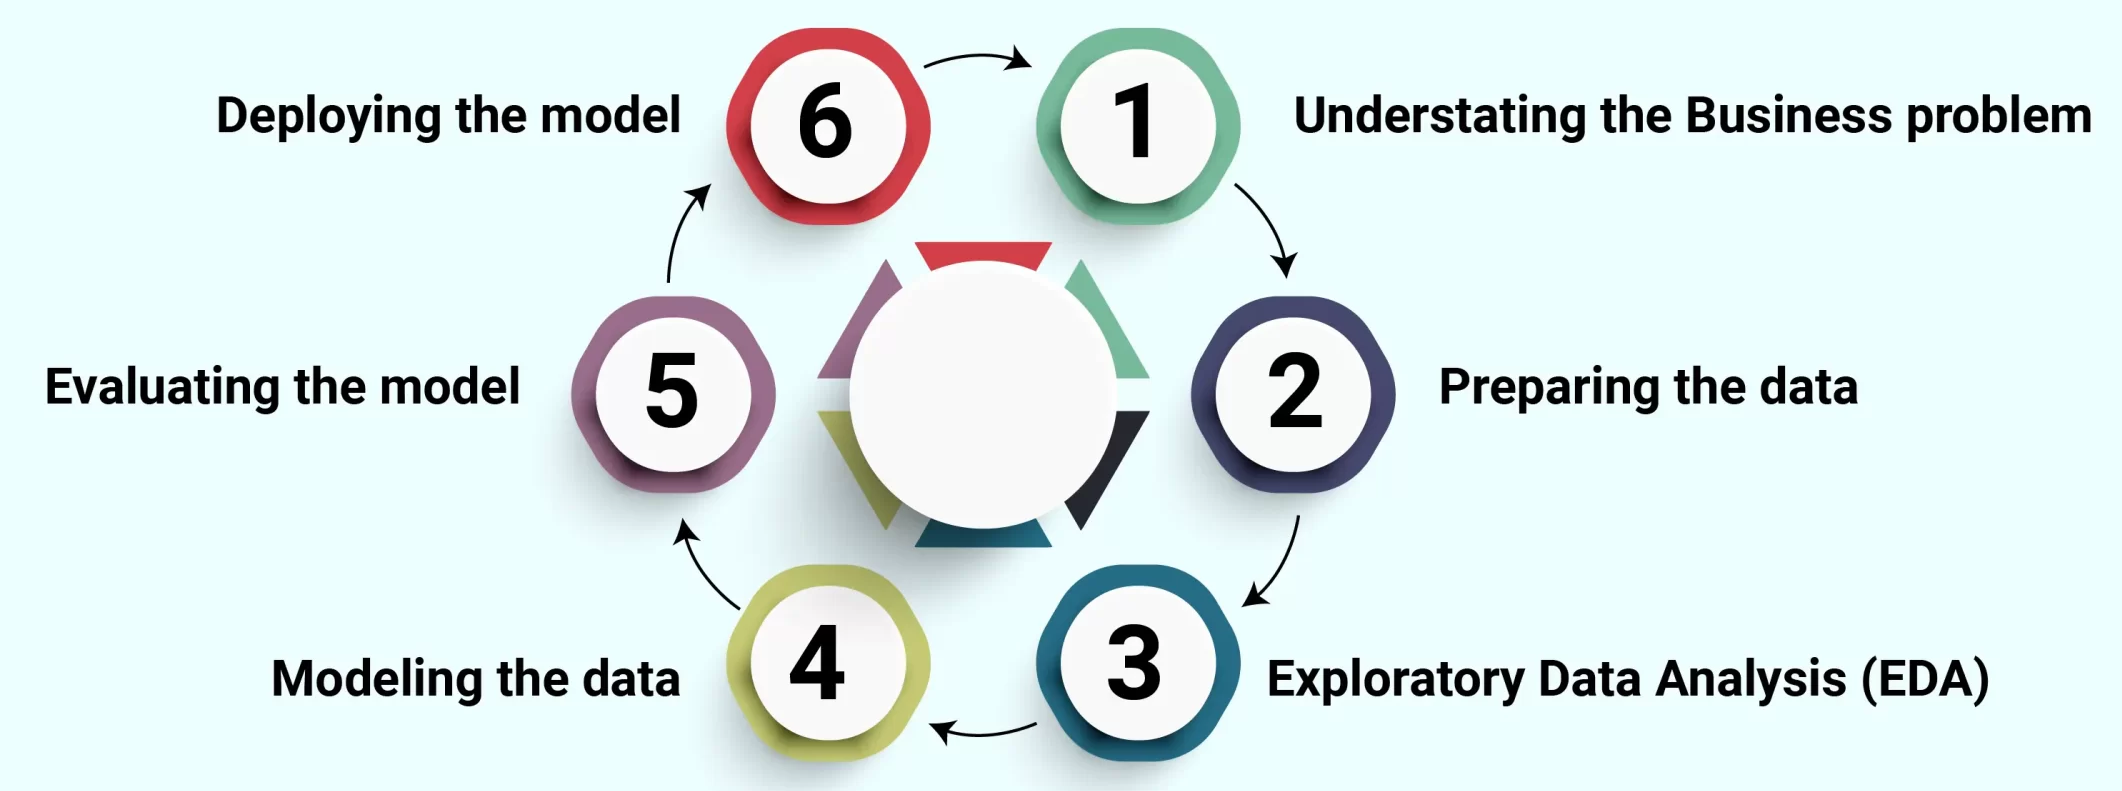
Fig. 1.4 General data science lifecycle model#
1.3. Data Science Careers#
There are plenty of jobs and career opportunities in the general field of data science. From the perspective of data science workflow /lifecycle (Fig. 1.5), we see that the four common data science related jobs roughly correspond with different phases of the workflow: Data Engineers with data collection and cleaning/cleansing, data analysts with data cleaning and EDA, machine learning engineers for model building and model deployment, while data scientists for the whole process of the workflow.
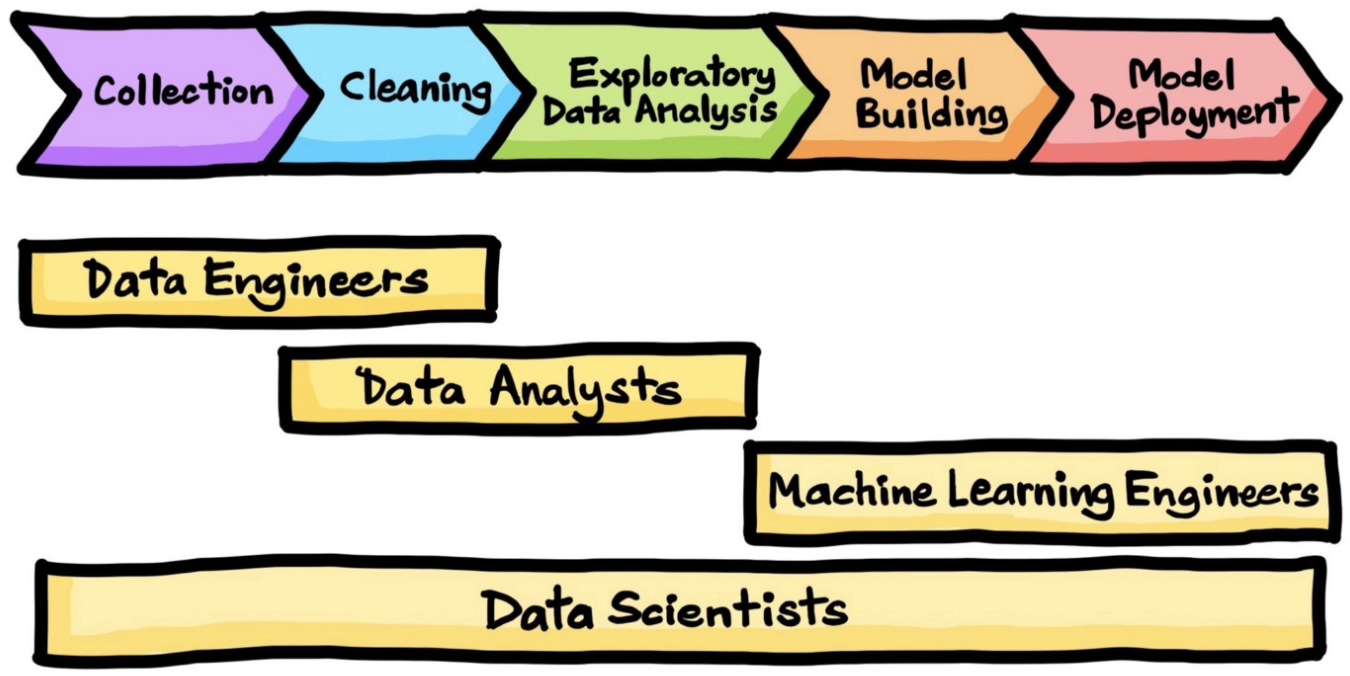
Fig. 1.5 Data science workflow and related job titles#
It is first noticed that, as technology advances, AI has become central to modern data work and is now foundational across the data stack. A quick search at an online job site (indeed.com ) using the term “data scientists” yields job titles showing that data science and AI are interconnect:
Generative AI/ML Data Scientist
Senior Agentic AI Data Scientist
Manager, Data Science - GenAI Digital Assistant
Senior Advanced AI Software Engineer
Data Scientist Lead - Bank AI/ML
Further, when searching for these related job titles, the results show that the term “Data Scientist” yields most (5000+) jobs, followed by “Data Engineer”, while “artificial intelligence” returns 8000+ jobs.
Data Engineer |
Data Analyst |
Machine Learning Engineer |
Data Scientist |
|---|---|---|---|
4,000+ |
3,000+ |
1,000+ |
5,000+ |
However, when searching using the field/skill-set terms: “Data Engineering”, “Data Analysis”, “Machine Learning”, “Data Science”, and add “Artificial Intelligence,” the term “data analysis” returns most job results, followed by AI. This result at least suggests that machine learning and AI have become essential in the data science job market.
Data Engineering |
Data Analysis |
Machine Learning |
Data Science |
Artificial Intelligence |
|---|---|---|---|---|
5,000+ |
9,000+ |
7,000+ |
7,000+ |
8,000+ |
1.4. Data Science Tools#
As an attempt to summarize data science tools in four stages of data science operations (data management, data manipulation, data analysis, and visualization), a researcher posted his data science tools summary on LinkedIn to ask for feedback.
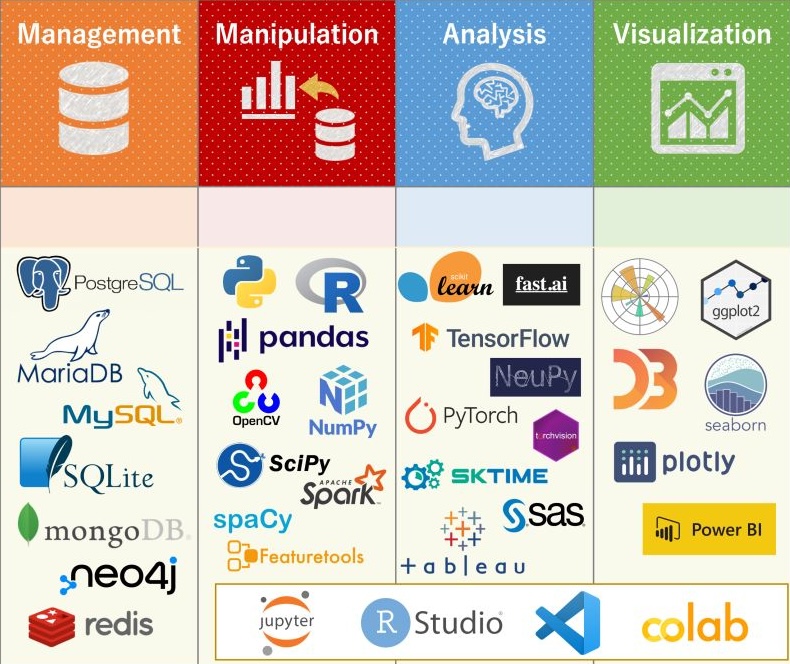
Fig. 1.6 Data Science Tools#
As seen in Fig. 1.6, the figure contains 4 groups of data science tools:
Data Management: Tools in this category are databases for data collection/acquisition and cleaning/cleansing. Most of the listed tools are SQL DBMS’s (except mongoDB, redis, and neo4j).
Data Manipulation: Programming languages such as Python and R, plus libraries such as pandas and NumPy are included.
Data Analysis: scikit-learn is a popular toolkit for machine learning analysis based on NumPy, SciPy, and matplotlib. PyTorch and TensorFlow are popular open-source machine learning frameworks primarily used for building and training deep learning models.
Data Visualization: Matplotlib is a comprehensive library for creating visualizations in Python. seaborn is a visualization library based on matplotlib providing a high-level interface for drawing statistical graphics.
Other Tools: Jupyter Notebook, along with other Jupyter products, is a web-based interactive development environment allowing for the creation and sharing of documents, code, and visualization. Jupyter Notebook has become a type of Integrated Development Environment (IDE) and it works more than 40 languages including Python, R, and Scala.
Note that while there are a large number of data science tools to choose from, beginners may pick one from each of the categories to start learning. Once you master a tool, it is often very easy to transfer the concepts and skills to another in the same category. For example, all SQL tools are different flavors of the same language standard; and almost all programming languages share the same basic constructs.
1.5. Resources#
Chapman, P., Clinton, J., Kerber, R., Khabaza, T., Reinartz, T., Shearer, C., & Wirth, R. (2000). CRISP-DM 1.0: Step-by-step data mining guide. The CRISP-DM Consortium.